MAD scans and wavelength selection
Fluorescence scans
Although theoretical calculations provide an accurate measure of the anomalous and dispersive differences for a given atom at most wavelengths, the values of f’ (dispersive signal) and f” (anomalous signal) around the absorption edges are (usually) significantly different from the theoretical values and must be determined experimentally. A good explanation of this is on Ethan Merritt’s anomalous scattering pages, although the actual effect varies greatly between elements. Usually f’’ will be significantly higher than the theoretical value, sometimes 2x or more.
The wavelength at which anomalous signal peaks changes depending on the chemical environment in the crystal and hence may be slightly different from the theoretical peak for a given element. I’ve seen a difference of 2eV in the Se peak between derivative crystals of two entirely different proteins. My personal experience has been that these values don’t change from crystal to crystal of the same protein, but this may not be true if different cryoprotectants are used - I’ve never tested that. FYI, the “edge” is not the same thing as the peak as I originally assumed; the peak will be a few eV higher, and the inflection point will be slightly below the edge.
The phrase "fluorescence scan" isn't entirely appropriate; what we're actually interested in is ''absorbance'' as a function of energy/wavelength, and the fluorescence is just a measure of this. (Think of it like using fluorescence at ~345nM to measure the absorbance of UV by tryptophan residues.)
Taking a MAD scan
This is pretty easy. Click on the “Scan” tab in Blu-Ice, and select the element you’re looking for in the periodic table by clicking on the appropriate edge name. Lighter elements, such as selenium, bromine, and the transition metals, only have a K edge. Heavy metals have additional L edges (L1, L2, and L3) which are what we use at a beamline (if anyone knows of an exception, please add it here!). The L3 edge is the appropriate one to use for MAD, because although the anomalous signal is not as high as it is at the L1 and L2 edges, the dispersive signal is much larger. For the most popular atoms such as platinum and mercury, the L3 edge is also at the most advantageous wavelength, where flux is highest. (The L edges occur at increasingly longer wavelengths from L1 to L3.)
There may be cases where a different L edge is better - the lanthanides, perhaps? - but I've never been in a situation where this came up.
When you take a scan, the fluorescence should start to shoot up around the absorbance edge of the element, probably by at least 10000 counts. It won’t necessarily be a spike - this depends on the particular element - but if you don’t see a large and relatively sudden increase, the derivative isn’t bound (obviously this should not be an issue with selenium). With the quick soak ions such as Br/I/Cs/Rb, you’ll see a spike no matter what due to the high concentration in solution. James told me that the concentrations at which heavy metal quick-soaks are done (typically 5-10 mM) aren’t high enough to give a large signal from solution alone, so the fluorescence from the crystal is what’s important.
Example fluorescence scans
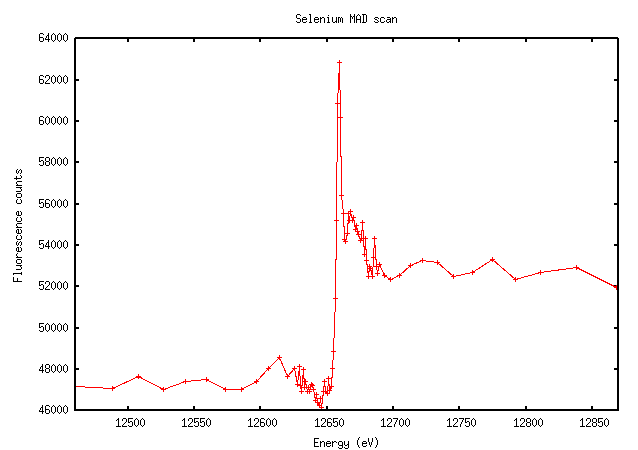
Selenium has an extremely sharp edge with a very clear peak:
Bromine isn’t quite as sharp, but very distinct nonetheless:
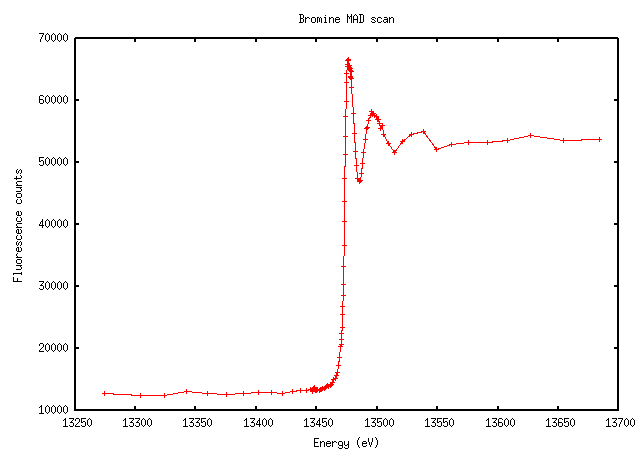
The increase in fluorescence counts above the edge is enormous here because there's 0.5M bromine in the cryo solution.
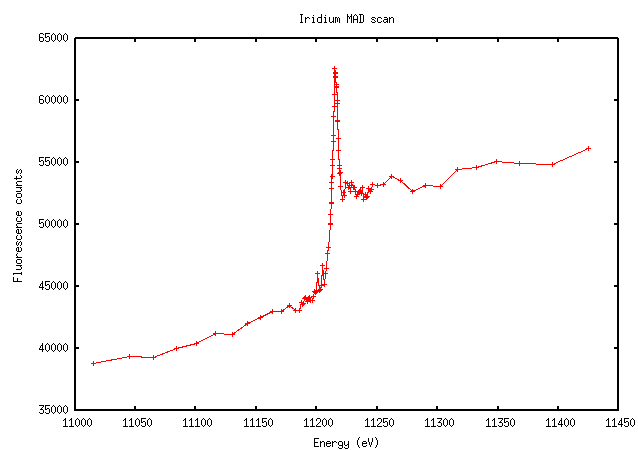
“Traditional” heavy metals have more varied scans. Iridium, for instance, has a relatively clear edge and peak, although the edge doesn’t appear quite as steep:
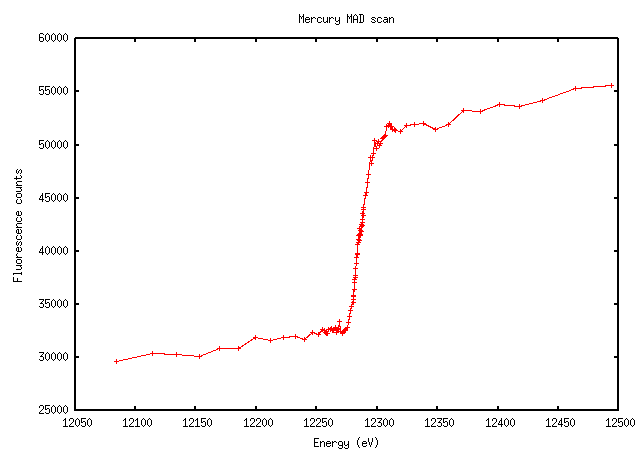
Mercury scans are just a mess. This example, however, is exactly what we hope to see - note the large increase in fluorescence signal above the edge:
Interpreting the output
The results of the fluorescence scan are converted to a calculation of f’ and f” as a function of wavelength through an equation called the Kramers-Kronig transform. I don’t understand it; go look at Ethan Merritt’s page again. Suffice to say that you’ll get a graph that looks something like this (for the selenium scan above):
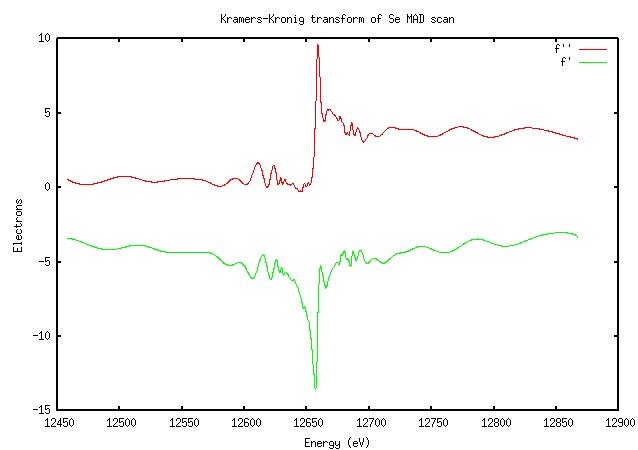
It won't look exactly like this; in Blu-Ice f' and f" are on different axes, and I may have the colors reversed.
Not surprisingly, this looks very similar to the scan. The importance of doing a scan should be clear from this image: the value of f” at the peak is much higher than the theoretically predicted value (9.6 versus 3.8). The software calculated the peak and inflection points as 12657eV and 12659eV (they’re not usually that close for elements other than selenium), which is very close to the expected K edge of selenium at 12658eV.
For some elements - I'm thinking of mercury here - the software's interpretation may be screwy and it will give a peak at some inappropriately high energy because the "peak" isn't much of a peak, e.g. in the Hg scan above. Based on the scan and the Kramers-Kronig transform that will be derived from it, you should be able to pick a better wavelength where both anomalous and dispersive signals are large. You can pick whatever remote wavelength you prefer, since the theoretical calculations will be appropriate and consistent away from the edge; see the next section. The energy printed in the interface is just a suggestion.